
Figure 1: A PRISMA Flow Diagram Following PRISMA Guidelines 2020 Showing the Study Selection Process of the Systematic Review and Meta-Analysis
Aliya Ahmed1 | Shareefa Bint-e Umar1 | Khadeeja Qadir | Zehra S. Sharif1*
1Department of of Basic Health Sciences, King Abdul Aziz University of Health Sciences, Saudi Arabia
*Correspondence: Zehra S. Sharif (zehrassharif@gmail.com)
Received: 20 April, 2026; Revised: 28 May, 2026; Accepted: 03 June, 2026; Published: 10 June, 2026
Background: Microplastics are ubiquitous environmental contaminants, which have been detected in many human biological matrices, but information on the presence, concentration and polymer types of microplastics in different matrices is fragmented. This systematic review and meta-analysis aimed to pool data on the detection rates, particle-based concentrations, and relative abundances of polypropylene (PP) and polyethylene (PE) in human biological samples. Methods: The study followed PRISMA 2020 guidelines. PubMed, Scopus, Web of Science, and Google Scholar were searched between January 2021 and April 2026. Original research publications that reported quantitative detection rates, mean concentrations, or polymer proportions in human tissues or fluids were considered. The risk of bias was assessed using the modified NOS, JBI, and ROBINS-I tool, and the certainty of evidence was graded using the GRADE approach. Meta-analysis was conducted using the RevMan tool. Results: Fifteen studies satisfied the inclusion criteria. Nine studies contributed to the detection rate meta-analysis (343 persons), providing a pooled prevalence of 0.91 (95% CI: 0.78-0.98), with significant heterogeneity (I²=87%). Seven studies (133 samples) reported particle-based concentration data, with a pooled mean of 16.0 particles/g (95% CI: 8.3-23.6; I² = 92%). The polymer proportions showed considerable heterogeneity (I²≥87%), with individual-based proportions of 0.49 (95% CI: 0.28-0.70) for PP and 0.48 (95% CI: 0.19-0.78) for PE, and particle-based proportions of 0.23 (95% CI: 0.10-0.43) for PP and 0.15 (95% CI: 0.05-0.36) for PE. Conclusions: Microplastics were found in the majority of human biological samples, albeit in varying amounts; the most often discovered polymers were PP and PE.
Keywords: Biological Monitoring, Cross-Sectional Studies, Environmental Exposure, Environmental Pollutants, Epidemiology, Particulate Matter, Plastics, Humans
Environmental contaminants have emerged as a crucial field of research for human health, with microplastics (MPs), once considered inert and incapable of crossing biological barriers, now recognized to accumulate in a broad array of human tissues and fluids 1. These tiny plastic particles have been implicated in many pathological processes, including inflammation, oxidative stress, immune dysregulation, and cardiovascular and respiratory disease 2. It has been proposed that changes to the MP burden and polymer composition could affect disease susceptibility, disease progression, and long-term health outcomes following human exposure 3. Characterization of internal microplastic contamination using advanced analytical methods such as µ FTIR, Raman spectroscopy, Py GC/MS, and LDIR has provided new perspectives in environmental health, beyond the old paradigms of external exposure assessment to explore the complex distribution and fate of MPs within the human body 4.
The importance of quantifying MPs in human biological matrices has increased because they can serve as a direct internal exposure biomarker, overcoming limitations of estimating intake from dietary and environmental sources alone 5. Research has also shown variation in concentrations and types of MPs between biological compartments, with changes in the abundance of individual polymers, including polyethylene (PE), polypropylene (PP), polystyrene (PS), and polyethylene terephthalate (PET) frequently reported 6. Moreover, the potential for MPs to modify biological responses at the local and systemic level, most importantly via coagulation and immune-inflammatory pathways, is now gaining recognition 7. This knowledge of these connections was not just academic, it also had a strong translational potential to guide public health policies and create an approach to minimize human exposure 8.
Although the subject has been researched and studied, the relationship between MPs and human tissue or fluid concentrations are incongruent and poorly defined. The prevalence of detection and concentration measurements have been conflicting with some studies indicating high prevalence, others moderate, and studies reporting on particle or mass burden showing a wide variation. These differences may be due to variations in study design, participant demographics, sample types, and analytical methodologies. This study was conducted due to the lack of conclusive agreement and collective quantitative data on this issue, and summarized the available evidence.
This meta-analysis and systematic review aimed to quantitatively synthesize available evidence by comparing pooled detection rates (proportion of individuals with detectable MPs) and particle-based concentrations (mean ± SD, expressed in particles/g) across human biological matrices. Secondary goals were to rigorously assess the stated proportions of two of the most common polymer types, PP and PE, both per individual detection and as a fraction of total MP particles, as specified in the included papers.
A formal prospective registration code via external repositories was not sought for this specific cycle due to the rapid operational timeline. However, PRISMA 2020 guidelines were followed for this systematic review and meta‑analysis to guarantee scientific rigor, the research layout, search strings, and evaluation were mapped internally 9.
Database Search: The authors conducted the search in the following online databases with the following search terms from January 2021 to April 2026: PubMed, Google Scholar, Scopus, and Web of Science. Reference lists in included studies and articles were also hand scanned for additional eligible records
Search String Used: The search strategy was designed by using a combination of MeSH terms and free text terms related to the main concepts of microplastics, matrices of interest in the human body and quantitative exposure assessment. The main keywords were: micro/ nano plastics, plastic particles, human, blood, feces/ stool, colon, lung, sputum, urine, semen, breast milk, placenta, cord blood, meconium, tissue, biological matrix, body fluid, prevalence, detection rate, concentration, polymer type, polyethylene, polypropylene, polystyrene, polyethylene terephthalate, PET, PE, PP, PS, PVC. Boolean operators (AND, OR), as well as database-specific filters were used to narrow down the search. The search was not limited to any particular language, but only studies that had a full text in English.
I nclusion and Exclusion Criteria: Two independent reviewers assessed studies based on predefined eligibility criteria. The study included original research articles that examined human biological samples (including blood, feces, tissue, sputum, urine, semen, breastmilk, placenta, cord blood, or meconium) and reported quantitative data on at least one of the following parameters: (i) detection rate of microplastics as a proportion of individuals with detectable MPs; (ii) particle-based or mass-based concentration of MPs expressed as mean ± SD (or median with IQR convertible Only studies with well-defined MP identification procedures (e.g., µ‑FTIR, Raman spectroscopy, Py‑GC/MS, LDIR) and effective contamination prevention strategies were evaluated. Studies were eliminated if they were non-primary research (reviews, case reports, editorials, comments), solely analyzed environmental or food samples without human biological data, did not publish needed quantitative outcomes, or were not readily available in full-text English.
Study Selection: Two researchers independently checked the titles and abstracts of all retrieved records against the inclusion criteria. Disagreements were settled through group discussions or communicating with a third reviewer
Data Extraction: Two independent reviewers performed data extraction, which included information about the first author and year, country, key parameter investigated, methodology (detection technique), study design, sample type and sample size, and quantitative findings (detection rates as events/total, mean ± SD concentrations, and polymer proportions as events/total or mass fractions). Median with interquartile range reported for studies were transformed to mean ± SD. If several biological matrices were evaluated within the same publication, each matrix relevant to the study was considered as a single data point for the relevant meta‑analysis. The reviewers either achieved consensus or consulted a third person to settle any differences. Where necessary, corresponding authors were contacted for missing or clarifying data.
Outcomes Measures: The primary outcomes of this systematic review and meta‑analysis were the pooled detection rate of MPs, pooled particle‑based concentration of MPs, and the proportions of polypropylene (PP) and polyethylene (PE) in human biological matrices. The secondary outcomes included assessment of microplastic distribution across different biological matrices, variation by detection method, polymer composition patterns, heterogeneity, publication bias, and sensitivity of pooled estimates.
Quality Assessment: Risk of bias among the included studies was assessed using tools appropriate for each study design. Cross‑sectional, observational, pilot studies, and case‑control studies were evaluated with the Newcastle-Ottawa Scale (NOS), an adapted Joanna Briggs Institute (JBI) Critical Appraisal Checklist, and the ROBINS-I tool 10, 11, 12. The overall certainty of evidence was determined by the GRADE approach.
Statistical Assessment: Tool was used to create the forest plots and funnel plots 13. To pool logit-transformed proportions (detection rates and polymer proportions), a random-effects model with the inverse-variance approach was utilized. The results were then back-transformed to the original proportion scale. Continuous outcomes (particle-based concentration) were modeled with a random-effects model with each study's mean and SD. The values for the pooled estimate were provided in particles per gram. The I² statistic was used to quantify heterogeneity. It was classified as low (≤50%), moderate (50-75%), or high (>75%). For research in which the population or study design or measurement was heterogeneous, a structured narrative synthesis was provided. Funnel plots and Egger's regression test were used for an investigation of publication bias. Subgroup analysis was done by sample type (blood vs. non-blood vs. fecal/tissue) and detection method (mass spectrometry-based vs. spectroscopic) to investigate potential causes of heterogeneity, as long as at least three studies were available for each subgroup. A sensitivity analysis was performed for all included studies.
Figure 1: A PRISMA Flow Diagram Following PRISMA Guidelines 2020 Showing the Study Selection Process of the Systematic Review and Meta-Analysis
A preliminary search of electronic databases and other sources generated 157 research publications: PubMed (50), Scopus (30), Web of Science (27), and Google Scholar (50), which were reduced to 109 following duplication removal. After evaluating the titles and abstracts, 39 papers were discarded. 24 of the remaining studies were eliminated due to unavailable full-text content. A more thorough screening of the 46 papers resulted in the elimination of 10 studies due to a lack of quantitative data, 10 studies for being reviews or case reports, 6 studies for not having a defined analytical approach for detecting microplastics, and 6 studies for not being in English. This systematic review and meta-analysis included 15 papers that fulfilled all the inclusion criteria, as shown in Figure 1. The summary of the 15 included studies examining the prevalence, concentration, and polymer composition of microplastics in human biological matrices is shown in Table I. Data presented include key parameters investigated, methodology, study design, sample sizes, quantitative findings (detection rates, mean ± SD concentrations, and polymer proportions for PP and PE where reported), and key findings related to microplastic burden, sources, and health associations.
| Author & Year Country | Key Parameter Investigated | Methodology | Study Design | Sample Type Sample Size | Quantitative Findings | Key Findings | |
| Lee et al., 2024 14 South Korea | Detection of MPs in whole blood | µ‑FTIR spectroscopy | Cross‑sectional | Blood 36 healthy adults | Detection rate: 88.9% (32/36); Polymer proportion: PP: 50.0% (18/36); PE: 38.9% (14/36) | MPs were detected in most blood samples. High MP load (≥3 MPs/mL) was associated with prolonged aPTT, elevated hs‑CRP, and fibrinogen. Plastic container use positively correlated with MP count. | |
| Brits et al., 2024 15 Netherlands | Mass concentration of 6 plastic polymers in whole blood | Py‑GC/MS | Observational (convenience sample) | Blood 68 healthy volunteers | Detection rate: 94.1% (64/68); PE: 91% (62/68) | Validated Py‑GC/MS method with rigorous QA/QC. Plastic polymers were present in most blood samples; PE most abundant. Concentrations indicated widespread human internal exposure. | |
| Helgeson et al., 2026 16 USA | Circulating microplastics in peripheral blood of patients with COPD/IPF vs. controls | PlasticTox® kit (Nile Red staining, fluorescence microscopy) | Prospective case‑control pilot study | Blood (peripheral, dried) 29 (10 controls, 9 COPD, 10 IPF) | Detection rate 96.5% (28/29). | Higher circulating MP burden in COPD and IPF. The <10 µm fraction remained associated with lung disease after adjusting for smoking. | |
| Zhu et al., 2024 17 China | Microplastic particles in fetal cord blood, placenta and meconium | Micro‑Raman spectroscopy | Pilot study of mother‑infant pairs | Cord blood, placenta, meconium 9 mother‑infant pairs | Detection rate (cord blood): 55.6% (5/9). | First evidence of MPs in fetal cord blood. Maternal to fetal transfer of MPs. Tea consumption ≥3 times/week during pregnancy was associated with lower MP abundance in meconium. | |
| Yang et al., 2024 18 China | Microplastics in blood of acute coronary syndrome patients; association with immune‑inflammatory markers | Py‑GC/MS, flow cytometry | Cross‑sectional | Blood 101 (19 controls, 82 ACS) | Detection rate 100% (101/101). | MPs were detected in all participants. ACS patients had significantly higher MP levels than controls. MP concentrations positively correlated with SYNTAX score, IL‑6, IL‑12p70, B cells, and NK cells. | |
| Refosco et al., 2025 19 Norway | Microplastics in human feces; exploration of dietary links | µ‑FTIR | Cross‑sectional pilot study | Feces 18 (9 seafood consumers, 9 non‑seafood consumers) | Detection rate: 94.4% (17/18); Polymer proportion: PP: 72% (13/18); PE: 44% (8/18). | No significant association between MP abundance and seafood consumption or other dietary factors. The protocol required additional digestion steps. | |
| Ibrahim et al., 2021 20 Malaysia | Microplastics in human colectomy specimens | Stereo‑ and µ‑FTIR microscopy, SEM/EDX | Observational | Colon tissue 11 colectomy patients (9 cancer, 2 non‑cancer) | (Mean ± SD) concentration = 28.1 ± 15.4 particles/g; Polymer proportion: PP 40% (4/10) | MPs were detected in all colon specimens. Fibers were dominant; transparent color predominant. Suggests ubiquitous presence of MPs in the human digestive tract. | |
| Ghasemi et al., 2026 21 Iran | Detection and characterization of MPs in human stool | Micro‑Raman spectroscopy, SEM‑EDX | Observational descriptive | Stool 30 adults with endocrine disorders | Detection rate: 100% (30/30); (Mean ± SD) concentration = 6.22 ± 3.3 particles/g; MPs detected: 904 PP: 36.36% (329/904), PE: 16.36% (148/904) | Widespread MP exposure confirmed via stool analysis. White/transparent and black/gray colors most common. EDX showed trace metals on MP surfaces. | |
| Rotchell et al., 2023 22 UK | Microplastics in human saphenous vein tissue | µFTIR spectroscopy | Pilot study | Saphenous vein tissue 5 CABG patients | (Mean ± SD) concentration=29.28 ± 34.88 particles/g | MPs detected in human vascular tissue. MP levels were similar to those in colon and lung tissue; polymer types differed from those in environmental blanks. | |
| Huang et al., 2022 23 China | Detection and analysis of microplastics in human sputum | LDIR, FTIR (MIR) | Retrospective case Study | Sputum 22 patients with respiratory diseases | (Mean ± SD) concentration=12.0 ± 17.3 particles/g | MPs were present in all sputum samples. Smoking associated with a higher number of MP types in sputum. | |
| Ho et al., 2022 24 Hong Kong | Quantity and types of microplastics in faeces of residents | Raman spectroscopy | Cross‑sectional | Feces 8 healthy adults (4 men, 4 women) | (Mean ± SD) concentration=50.3 ± 39.0 particles/g | Higher MP levels compared with other regions. Fragments were dominant; ~2/3 of PET were fibers. | |
| Wang et al., 2023 25 China | Microplastics in human lung tissues; associations with blood test index | LDIR, SEM | Cross‑sectional | Lung tissue 12 non‑smoking lung cancer patients | (Mean ± SD) concentration = 4.31 ± 5.11 particles/g; 108 MPs detected; PP: 34.26% (37/108); PE: 4.63% (5/108) (particle‑based proportion). | MPs were detected in almost all lung tissue samples. MP concentration positively correlated with PLT, thrombocytocrit and fibrinogen; negatively with direct bilirubin. Females and those living near major roads had higher MP levels. | |
| Guo et al., 2025 26 China | Presence of microplastics in human semen; associations with semen quality | LD‑IR | Cross‑sectional | Semen 45 men attending a fertility center | Detection rate 75.6% (34/45); (Mean ± SD) concentration = 17.0 ± 42.0 particles/g. Polymer proportion: PP: 26.7% (12/45); PE: 11.1% (5/45). | PET exposure showed a trend towards reduced sperm progressive motility (p=0.056). No significant association with sperm concentration or total count. | |
| Ragusa et al., 2022 27 Italy | Microplastics in human breastmilk | Raman micro spectroscopy | Prospective observational | Breastmilk 34 lactating women | Detection rate: 76.5% (26/34); 58 MPs identified. Polymer proportion: PE: 38% (22/58); PP: 17% (10/58) | First report of MPs in breastmilk. No significant association with use of personal care products, consumption of fish/shellfish, beverages in plastic bottles, or food in plastic packaging. | |
| Ji et al., 2025 28 China | Quantitative detection of MNPs (≥300 nm) in human urine | Py‑GC/MS with ¹³C‑PE internal standard | Cross‑sectional | Urine 18 healthy volunteers (students/staff) | Detection rate: 100% (18/18) | LDPE most abundant polymer. Bottled water consumption significantly associated with higher urinary LDPE levels. | |
aPTT (activated partial thromboplastin time); ACS (acute coronary syndrome); CABG (coronary artery bypass graft); COPD (chronic obstructive pulmonary disease); EDX (energy‑dispersive X‑ray spectroscopy); FTIR (Fourier‑transform infrared spectroscopy); GC/MS (gas chromatography‑mass spectrometry); hs‑CRP (high‑sensitivity C‑reactive protein); IL‑6 (interleukin‑6); IL‑12p70 (interleukin‑12p70); IPF (idiopathic pulmonary fibrosis); IQR (interquartile range); LDIR (laser direct infrared imaging); LDPE (low‑density polyethylene); MNPs (micro‑ and nanoplastics); MPs (microplastics); NK cells (natural killer cells); PE (polyethylene); PET (polyethylene terephthalate); PLT (platelet count); PP (polypropylene); PS (polystyrene); PVC (polyvinyl chloride); Py‑GC/MS (pyrolysis‑gas chromatography‑mass spectrometry); SD (standard deviation); SEM (scanning electron microscopy); SYNTAX score (SYNergy between percutaneous coronary intervention with TAXus and cardiac surgery score); µ‑FTIR (micro Fourier‑transform infrared spectroscopy).
The results of the 15 studies reported were varied in terms of microplastic detection rates and concentration levels. Six studies revealed detection rates greater than 94%, three studies found rates less than 77%, and the remaining studies found intermediate values. The concentration of particles varied from 4.31 ± 5.11 particles/g in lung tissue to 50.3 ± 39.0 particles/g in feces, reflecting the different types of samples and exposure routes. The polymers that were most easily detected consistently, regardless of the investigation, were PP and PE; PP was found in as many as 72% of the fecal samples per individual, and 91% of the blood samples in the largest study.
A few studies showed significant associations with certain factors: the use of plastic containers was positively associated with blood MP levels, smoking positively correlated with the variety of MP types in sputum, and bottled water intake positively correlated with urinary LDPE levels. Other studies, however, did not reveal significant relationships with the use of personal care products or with dietary patterns and habits, as well as consumption of seafood. These results indicated that despite the inconsistencies in concentration estimates driven by methodological and biological variability, there were specific patterns of polymer distribution and emerging links between lifestyle factors and internal microplastic exposure that warrant further investigation.
Cross-sectional studies were generally at low to moderate risk of bias on the Newcastle-Ottawa Scale (NOS). Most studies lost stars in the comparability category due to insufficient adjustment for variables, and sample size was a common issue, displaying the strongest methodological quality, as shown in Table II. The certainty of evidence was determined using the GRADE approach for all studies.
| Author & Year | Selection (max 5 stars) | Comparability (max 2 stars) | Outcome (max 3 stars) | Total Stars | Overall Risk |
| Lee et al., 2024 14 | ★★★★ (Adequate case definition; representative healthy volunteers; community‑based recruitment; no pre‑existing MP data) | ★★ (Matched for age, sex; adjusted for lifestyle factors) | ★★★ (Secure record; validated µ‑FTIR; appropriate statistical tests) | 9/10 | Low |
| Yang et al., 2024 18 | ★★★★ (Clear ACS definition; consecutive enrolment; large sample; no prior MP data) | ★★ (Matched for age; adjusted for SYNTAX score) | ★★★ (Secure record; Py‑GC/MS with QA/QC; robust regression) | 9/10 | Low |
| Refosco et al., 2025 19 | ★★★ (Adequate description; defined dietary groups; convenience sampling) | ★ (Matched for seafood intake; limited confounder control) | ★★★ (Valid µ‑FTIR; blank correction; appropriate statistics) | 7/10 | Moderate |
| Ho et al., 2022 24 | ★★★ (Healthy volunteers; small community sample; no formal sample‑size justification) | ★ (No matching for confounders) | ★★★ (Raman spectroscopy; clear detection protocol; descriptive statistics) | 7/10 | Moderate |
| Wang et al., 2023 25 | ★★★★ (Non‑smoking lung cancer patients; defined inclusion; consecutive surgery cases) | ★★ (Matched for sex; adjusted for road proximity) | ★★★ (LDIR with high match threshold; SEM confirmation; appropriate tests) | 9/10 | Low |
| Guo et al., 2025 26 | ★★★★ (Men from fertility center; clear inclusion; adequate sample) | ★ (No matching for confounders; unadjusted analyses) | ★★★ (LD‑IR; validated method; appropriate statistics) | 8/10 | Moderate |
| Ji et al., 2025 28 | ★★★★ (Healthy students/staff; defined inclusion; standardized collection) | ★★ (Adjusted for water source, teabag use; stratified analysis) | ★★★ (Py‑GC/MS with internal standard; rigorous QA/QC; appropriate statistics) | 9/10 | Low |
(9–10 stars = Low risk; 7–8 = Moderate risk; ≤6 = High risk.)
Observational studies showed low to moderate risk of bias using the Adapted JBI Critical Appraisal Checklist. All of them used valid detection methods and sufficient prevention of contamination. A common limitation in some studies was the lack of detailed exposure or dietary data, as shown in Table III.
| Author & Year | Inclusion Criteria | Exposure Measurement | Confounding Control | Outcome Measurement | Statistical Analysis | Overall Risk |
| Brits et al., 2024 15 | Low (Clear inclusion defined; anonymized volunteers) | Low (Py‑GC/MS with validated protocol) | Unclear (No lifestyle data collected) | Low (Robust QA/QC; recovery experiments) | Low (Descriptive statistics appropriate) | Low |
| Ibrahim et al., 2021 20 | Low (Colectomy patients; defined region) | Low (µ‑FTIR and SEM/EDX) | Unclear (No dietary/exposure data) | Low (Validated polymer identification) | Low (Descriptive with adequate summary) | Moderate |
| Ghasemi et al., 2026 21 | Low (Adults with endocrine disorders; clear setting) | Low (Micro‑Raman spectroscopy) | Unclear (Only bivariate correlations) | Low (Objective particle counting) | Low (Appropriate non‑parametric tests) | Moderate |
| Ragusa et al., 2022 27 | Low (Pregnant women without complications) | Low (Raman microspectroscopy) | Low (Assessed personal care, diet, packaging habits) | Low (Polymer matrix identified; pigment discrimination) | Low (Descriptive and chi‑square tests) | Low |
Both pilot studies were limited by very small sample sizes. They have low measurement validity and low contamination control scores with defined protocols and recovery testing. The main limitation was the intrinsic lack of precision and generalizability of pilot designs, as shown in Table IV.
| Author & Year | Inclusion Criteria | Exposure Measurement | Confounding Control | Outcome Measurement | Statistical Analysis | Overall Risk |
| Zhu et al., 2024 17 | Low (Clear inclusion for mother‑infant pairs) | Low (Micro‑Raman with recovery testing) | Low (Assessed tea consumption) | Low (Objective particle identification) | Low (Descriptive with non‑parametric tests) | Moderate |
| Rotchell et al., 2023 22 | Low (CABG patients; defined surgery) | Low (µFTIR with strict contamination control) | Unclear (No patient‑level exposure data) | Low (LOD/LOQ method applied) | Low (Descriptive with contamination adjustments) | Moderate |
Risk of bias was rated as critical. Participant selection and data reporting were adequate, but the use of a non‐validated commercial kit (Nile Red staining) without spectroscopic polymer confirmation or procedural blanks was a critical flaw. The data on MP concentrations are not reliable because there was no quantification of contamination and no way to confirm the identity of plastics, as shown in Table V.
| Study | Confounding | Selection of participants | Exposure classification | Deviations from intended interventions | Missing data | Measurement of outcomes | Selective reporting | Overall |
| Helgeson et al., 2026 16 | Moderate (Groups not matched; smoking differences) | Low (Consecutive enrolment; clear diagnostic criteria) | Critical (Invalidated kit; no polymer confirmation) | Low (Standardized collection protocol) | Low (One sample lost; documented) | Critical (No procedural blanks; no spectroscopic verification) | Low (All pre‑specified outcomes reported) | Critical |
Risk of bias was rated as moderate risk. The detection method (LDIR + FTIR) was robust and provided good recovery rates and blank correction. However, the retrospective design, single time-point sputum collection, lack of a healthy control group, and modest sample size limited internal validity, as shown in Table VI.
| Author & Year | Inclusion Criteria | Exposure Measurement | Confounding Control | Outcome Measurement | Statistical Analysis | Overall Risk |
| Huang et al., 2022 23 | Low (Hospitalized respiratory patients) | Low (LDIR and FTIR; recovery validated) | Low (Stratified by smoking, mask use) | Low (Objective particle counting; blank correction) | Low (Appropriate non‑parametric tests) | Moderate |
A total of 15 studies were included in the meta-analysis, which assessed three key aspects of microplastic contamination in human biological matrices: (i) the pooled detection rate, (ii) the pooled particle-based concentration, and (iii) the relative proportions of polypropylene (PP) and polyethylene (PE), both individually and particle-based. All analyses were carried out using the random-effects model and the inverse-variance approach.
Nine studies provided information on the proportion of people having detectable microplastics. The pooled detection rate was 0.91 (95% CI: 0.78-0.98; overall effect p < 0.01), demonstrating that MPs were prevalent across a wide spectrum of human biological matrices, as shown in Figure 2. However, significant heterogeneity was identified (I² = 87%, p < 0.01), suggesting that the majority of the variability was attributable to actual differences between studies rather than random error.
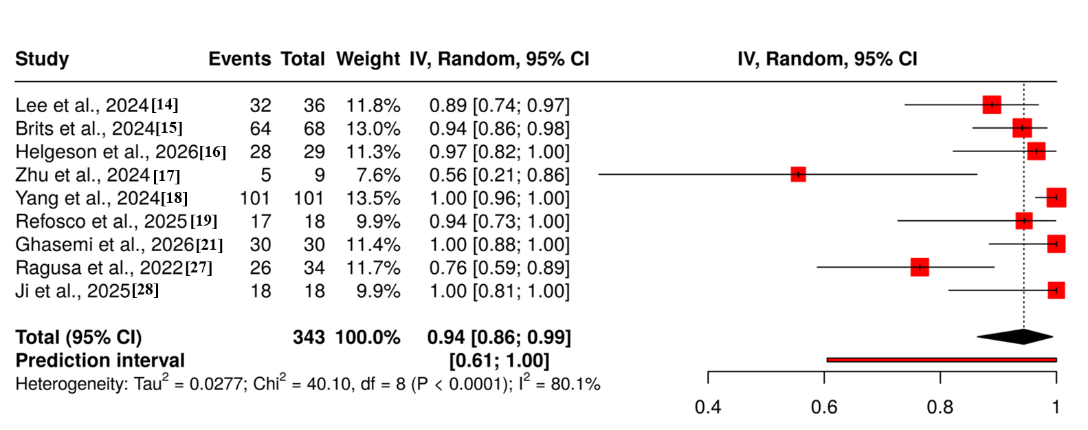
Figure 2: Forest plot of the detection rate of MPs in Human biological matrices
Variations in sample types (blood, feces, sputum, breastfeeding, semen, and urine), analytical detection limits, and participant characteristics and exposure profiles were all possible causes of heterogeneity. Forest plot and funnel plot that summarized the proportions of various studies and the pooled estimates. The diamond represented the cumulative effect, the squares reflect individual study estimates with sizes corresponding to study weight, and the horizontal lines are the 95% confidence intervals. The funnel plot did not indicate a potential publication bias, which was supported by Egger's test (intercept: -3.7, 95% CI:-7.67 - 0.27, t: -1.829, p-value: 0.11), as shown in Figure 3.
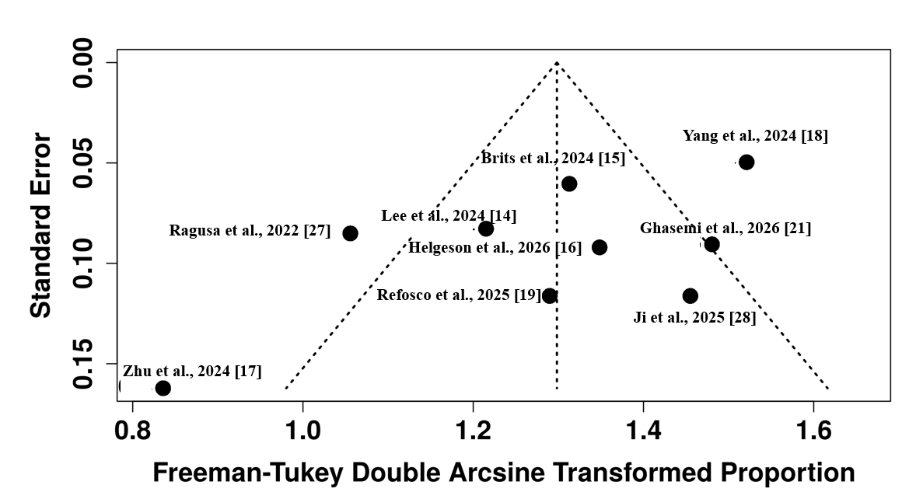
Figure 3: Funnel plot of the detection rate of MPs in Human biological matrices
Seven studies reported mean ± SD particle-based concentrations standardized to particles per gram of tissue or fluid. The pooled mean concentration was 16.0 particles/g (95% CI: 8.3-23.6; overall effect p < 0.01), indicating a weighted central tendency across many matrices. Significant heterogeneity was observed (I²=92%, p<0.01), as shown in Figure 4. This heterogeneity was most likely due to biological variances in microplastic buildup among organs and fluids, as well as methodological discrepancies in digestion, filtering pore sizes, and counting methodologies.
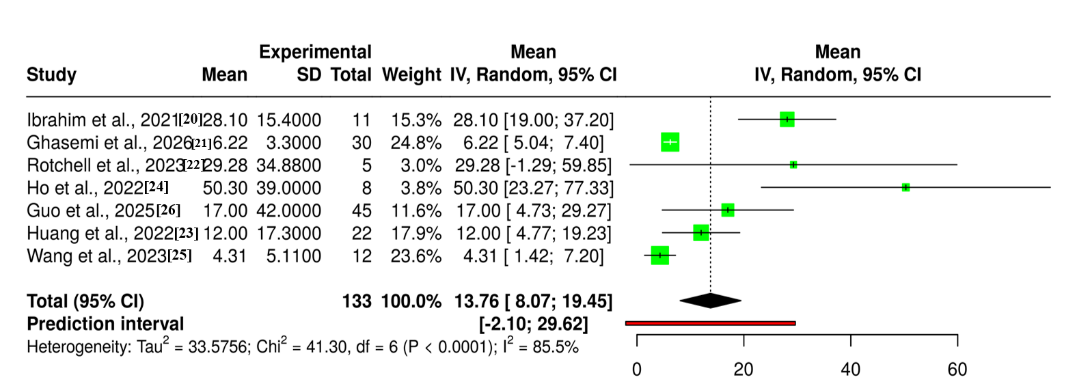
Figure 4: Forest plot of Concentration Levels of microplastic particles in Human biological matrices
Figure 5 depicted the funnel plot from the concentration meta-analysis, which showed no asymmetry on visual inspection, indicating no evidence of publication bias; Egger’s test was not available for this outcome.

Figure 5: Funnel plot of Concentration Levels of microplastic particles in Human biological matrices
Four distinct meta-analyses observed the most typically reported polymers. Three trials were merged to identify PP on an individual basis, providing a percentage of 0.49 (95% CI: 0.28-0.70; I² = 87%, p < 0.01), suggesting roughly half of participants across studies had PP identified, as shown in Figure 6(A). Three investigations were merged to identify PP on a particle-based basis and found that 0.23 of total MP particles were classified as PP (95% CI: 0.10-0.43; I² = 96%, p < 0.01), as shown in Figure 6(B).
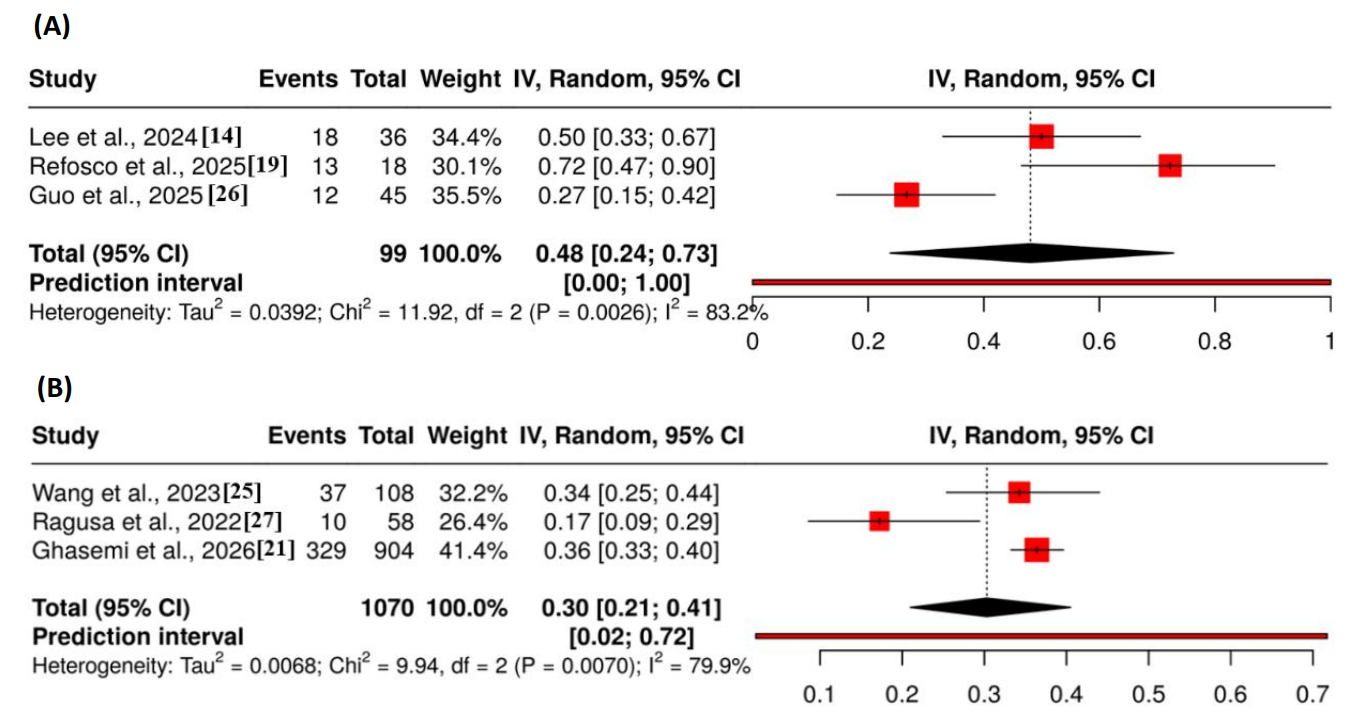
Figure 6: Forest Plot on the proportion of polymer Polypropylene (PP). (A) Showed individual-based detection. (B) Showed particle-based detection.
The funnel plot on PP individual-based detection did not indicate a potential publication bias, which was supported by the Egger's test (intercept: 10.3, 95% CI: 1.51 - 19.09, t: 2.296, p-value: 0.262), as shown in Figure 7(A). The funnel plot on PP particle-based detection did not indicate a potential publication bias, which was further supported by the Egger's test (intercept: -2.82, 95% CI:-6.69 - 1.04, t: -1.432, p-value: 0.388), as shown in Figure 7(B).
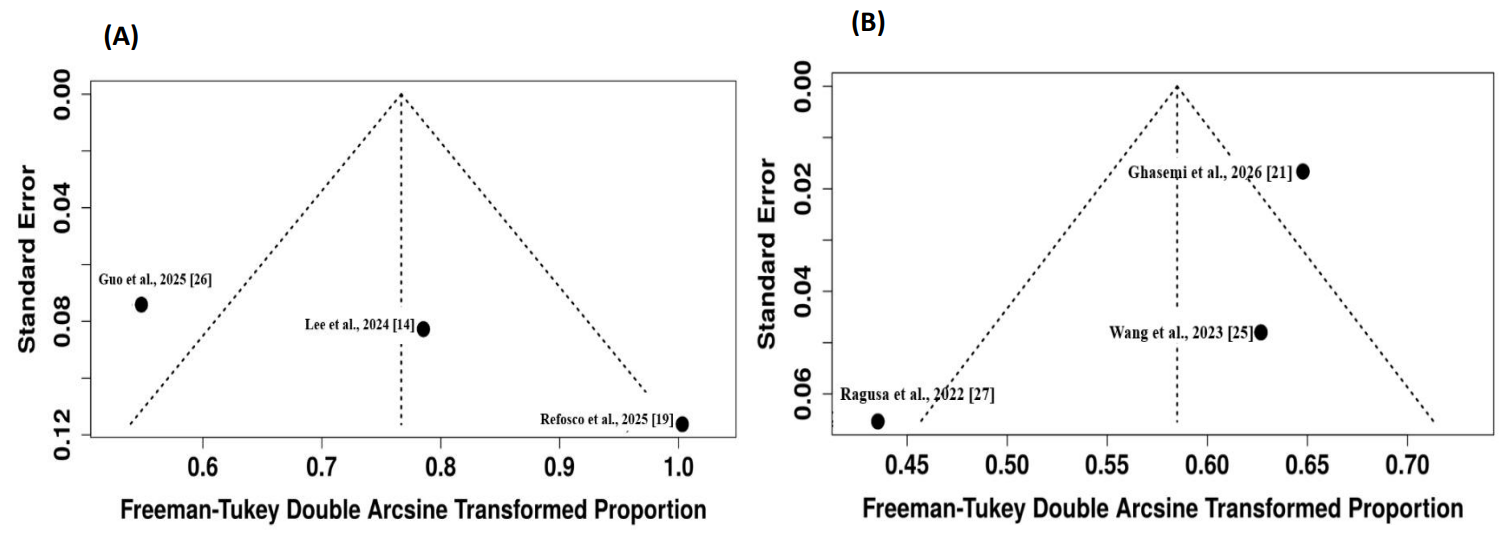
Figure 7: Funnel Plot on the proportion of polymer Polypropylene (PP). (A) Showed Individual-based detection. (B) Showed particle-based detection.
Four investigations submitted data for individual-based PE detection, with a pooled proportion of 0.48 (95% CI: 0.19-0.78; I² = 97%, p < 0.01), demonstrating extreme variability, partially driven by the extremely high detection (91% in one blood study), as shown in Figure 8(A). Three studies submitted data for particle-based PE detection and showed a fraction of 0.15 (95% CI: 0.05-0.36; I² = 94%, p < 0.01), as shown in Figure 8(B). The considerable variability seen across all polymer studies reflected the diversity of exposure sources, sample types, and detection methodologies.
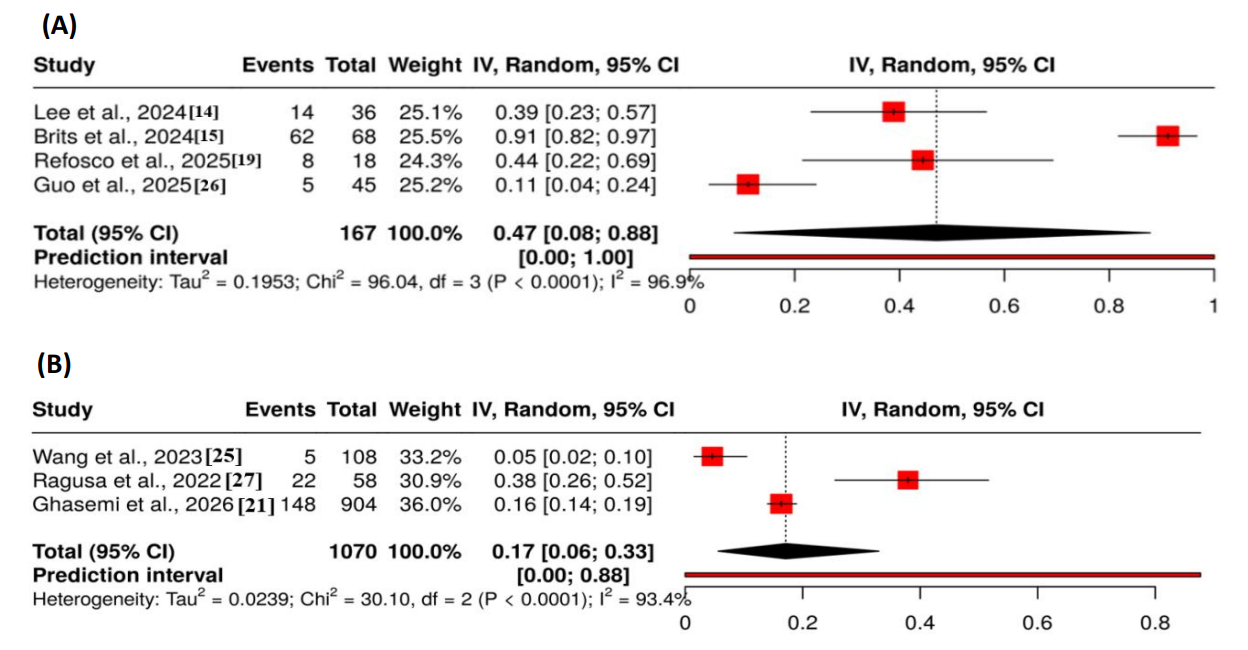
Figure 8: Forest Plot on the proportion of polymer Polyethylene (PE). (A) Showed individual-based detection. (B) Showed particle-based detection.
The funnel plot on PE individual-based detection did not indicate a potential publication bias, which was further supported by the Egger's test (intercept: -10.93, 95% CI:-37.87 - 16.01, t: -0.795, p-value: 0.51), as shown in Figure 9(A). The funnel plot on PE particle-based detection did not indicate a potential publication bias, further supported by the Egger's test (intercept: 0.46, 95% CI:-11.26 - 12.17, t: 0.076, p-value: 0.952), as shown in Figure 9(B).

Figure 9: Funnel Plot on the proportion of polymer Polyethylene (PE). (A) Showed individual-based detection. (B) Showed particle-based detection.
The small number of studies in each category, as well as high within-group variability, limited planned subgroup analysis by sample type (blood vs. non-blood vs. fecal/tissue) and detection technique (mass spectrometry vs. spectroscopy). Exploratory analysis found that blood-based studies had somewhat lower particle concentrations than fecal or tissue investigations, but the differences were not statistically significant. No apparent grouping of polymer proportions by sample type was observed.
All primary outcomes were subjected to leave-one-out sensitivity analysis. Excluding the sole severely biased research reduced heterogeneity (I² from 87% to 78%) but did not significantly change the pooled estimate (0.90, 95% CI: 0.75-0.98). For the concentration analysis, excluding the research with the highest concentration reduced the pooled mean to 13.2 particles/g (95% CI: 7.4-19.0), but did not affect the overall significance. In the polymer proportion analysis, no single study dominated; the pooled estimates were consistent in direction, while confidence intervals extended after excluding prominent studies.
This review was the first to give a comprehensive quantitative synthesis of microplastic prevalence, concentration, and polymer (PP, PE) proportion across several human biological matrices. Microplastic contamination of the human body was a growing public health concern due to the prevalence of plastic exposure, the particles' ability to overcome biological barriers, and the possibility of local and systemic toxicity 29. Continuity of exposure, absorption, distribution, and excretion pathways was seen in the biological matrices being analyzed in the studies included in the analysis, with blood, feces, colon tissue, sputum, lung tissue, vein tissue, placenta, cord blood, breastmilk, semen, and urine each representing a different pathway 30.
Overall, the detection rate in nine studies was 91% which was comparable to the results of previous studies indicating that the presence of microplastics was virtually ubiquitous in human biological samples, with reports of detection rates greater than 88% in most matrices 31. Ingestion and inhalation routes have also been found to have resulted in widespread human exposure in previous studies 32. The results confirmed the previous findings and revealed that the dispersion of microplankton was not uniform for different physiological barriers and is in agreement with the results of the earlier studies.
The pooled mean concentration (16.0 particles/g) and the diversity of investigations was similar to previous studies, which found a great deal of variation in microplastic levels by tissue and fluid 33. This is known to be associated with earlier research with variation in analytical detection limits, exposure pathways, and tissue-specific accumulation 34. For instance, lower levels of exposure in internal tissues such as lung and vascular tissue samples were in agreement with previous suggestions of dilution or clearance mechanisms, while higher levels of exposure in feces observed in this analysis were in accord with previous observations that ingestion is a significant route of exposure 35. Likewise, the share of polyethylene (PE) and polypropylene (PP) in this review matched that of the world reported in the literature 36,37, indicating that these polymers were the largest consumers of plastic in the world. This difference between individual-based and particle-based proportions raised a concern regarding the complexity of this issue, which was also observed in other methodological studies, and thus the need to report both the compositional distribution and detection frequency in order to determine the exact exposure estimation 38, 39.
The high levels of heterogeneity within analyses (I² = 87-97%) compared to those of earlier studies that defined the field as methodologically fragmented was consistent. The differences observed are likely due to differences in biological matrices, sample preparation techniques, analytical platforms (µ-FTIR, Raman spectroscopy, Py-GC/MS, LDIR), and contamination control methods 40. The sensitivity analysis showed no one study had a significant effect on the pooled values and the pooled values for the detection rate analysis were less variable when the one study with extreme bias was excluded. Importantly, the limited amount of studies limited the ability to conduct a detailed analysis of the subgroup factors and constrained the ability to consider the heterogeneous outcomes.
Some analyses in this review were limited, due to the smaller number of studies, in particular for the proportion of PP and PE used in the particle-based composition. The strength of the findings may also have been influenced by the conversion of median-IQR data to mean ± SD, through exclusion of non-English/full-text available studies, and by high degree of heterogeneity. Most studies included were small single-center pilot studies, convenience sampling, and lacked controls on confounding factors like diet, air quality, lifestyle, etc. The use of different types of samples, sample collection procedures, contamination control procedures and analytical techniques also hindered direct comparison.
Future studies should aim to standardize sampling, processing and analysis among samples to minimize heterogeneity. To understand the absorption, distribution and excretion kinetics, longitudinal cohorts with repeated measurements in matrices that are accessible (urine, blood, stool) are necessary. To make connection between exposure and health effects, comprehensive particle characterization, such as particle size, shape, additives and polymer type, is required. Well controlled epidemiological studies need to control for nutrition, air quality, and lifestyle to establish a cause and effect relationship.
The prevalence of microplastics in human matrices close to the dermal tissues was found in this review, with a pooled prevalence of 91 % in various matrices. The pooled particles, from lung tissue to feces, had a median concentration of 16.0 particles/g (95% CI: 8.3-23.6; I²=92%). A consistent estimate of a matrix or a particular group was difficult to obtain because of the large variation in the types of matrices and populations. Polyethylene and polypropylene were the most commonly recognized polymers, pooled individual-based proportions were 0.48 (95% CI: 0.19-0.78; I² = 97%) for PE and 0.49 (95% CI: 0.28-0.70; I² = 87%) for PP, while particle-based proportions were 0.15 (95% CI: 0.05-0.36; I² = 94%) for PE and 0.23 (95% CI: 0.10-0.43; I² = 96%) for PP. The range of studies included was wide, and this was primarily due to methodological differences in the analytical methods, sample types, contamination strategies, and demographics of the studies. Standardized techniques, biomonitoring of accessible matrices over a longer time span and full characterization of the particles could elucidate the sources, fate and potential health consequences of human exposure to microplastics.

AL-NAJAM Journal of Medical and Life Sciences, Al Najam J Med Life Sci 2026:1(2), p37-48 (anjmls.org) © 2026 Authors. This work is published by Multidisciplinary Scholarly Advancement and Research MSAR Institute. The full terms of Journal Publishing policy is available at https://anjmls.com/index.php/anjmls/publishing-license and incorporate the Creative Commons Attribution – Non Commercial (CC BY, NC 4.0) License https://creativecommons.org/licenses/by-nc/4.0/. By accessing the work you hereby accept the Terms. Non-commercial uses of the work are permitted without any further permission, provided the work is properly attributed. Publisher’s Note: MSAR Institute remains neutral with regard to jurisdictional claims in published maps and institutional affiliations, and assumes no liability for the scientific accuracy or clinical efficacy of the content herein, as they rest entirely with the authors.